Field Methods
|
In fall 2018, Radford University BIOL 476: "Forest & Wetland Ecology" students and Dr. Christine Small conducted a forest health assessment at Wildwood Park in Radford, Virginia. Environmental data and vegetation inventories were conducted at locations throughout the park to document plant species present and investigate forest structure, composition, and disturbance impacts.
Twelve 400 m² vegetation plots were established on east- and west-facing slopes and floodplain habitats across the park. When establishing each plot, we chose areas that were relatively uniform and representative of the forest type present (not an edge habitat, without numerous fallen trees, etc.). Plot shape was configured to best-represent landscape features. If the terrain was restricted because of streams, paths, or topography, plots were established parallel to the slope or habitat feature (10 x 40 m rectangular plots). If the habitat was relatively uniform, plots were set up in a 20 x 20 m square configuration. This resulted in nine 20 x 20 m square plots and three 10 x 40 m rectangular plots. In each plot, we recorded information on plot shape, dimensions, and location (longitude and latitude) using a GPS. Other site environmental data collected in each plot included:
Tree and shrub data was collected in 4 - 10 x 10 m subplots within each plot. In each subplot, each tree and shrub species were identified and Diameter at Breast Height (DBH) measured using a DBH tape). Small trees and shrubs (stems reaching 1.37 m height but DBH smaller than 2.5 cm) also were identified to species and counted. Percent of each subplot covered by tree canopy, shrubs, and herbs was estimated visually, as well as percent of each subplot covered by each invasive tree and shrub species. Tree diameter data was used to calculate species basal area (total area occupied by all individual trees of a species; m²/ha) and species density (number of individuals per area; stems/ha). Basal area and density data then were used to calculate relative basal area (species basal area/total plot basal area; percentage), relative density (species density/total plot density; percentage), and a Relative Importance Value (average of relative basal area and density; percentage) for each tree species in each plot. |
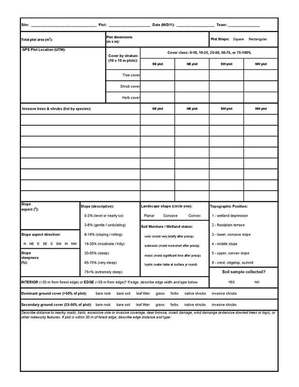
Field data sheet used to collect data on environmental and site conditions at Wildwood Park.
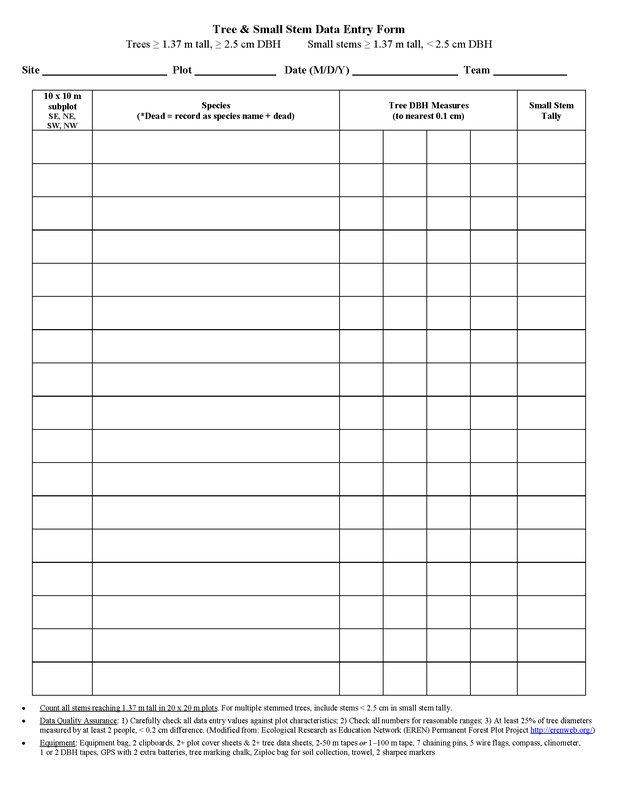
Field data sheet used to collect data on trees and saplings at Wildwood Park.
|
Soil Chemical and Textural Analysis
Soil texture, color, and organic matter are key parameters to determine overall plant and forest health. Texture is an indicator of water retention, color influences pH levels and oxygen levels, and organic matter shows the physical and chemical properties like solubility. Understanding nutrient availability and optimal soil conditions will help communities better manage healthy plots as well as preventing pollutants seeping into the area.
Soil texture is the physical roughness or smoothness of the soil that will separate it into categories of sand, silt, and clay. Identifying the type of soil determines water-holding capacity which is telling of the site’s overall moisture. Its soil property shows how much wind or water erosion took place, and how much plant nutrient storage a site can handle. (Presley & Thein. 2008) Without studying the soil texture, one could not know the contaminants movement or power needed to dig and till the area.
Soil texture is a strong indicator of soil moisture - and closely linked to the types of trees that live in a particular habitat. Trees indicative of hydric soils are typically "stress tolerators" because they can survive in water-logged or oxygen-depleted soils. Typical hydric species include sycamore (Platanus occidentalis), green ash (Fraxinus pennsylvanica), box elder (Acer negundo), and red maple (Acer rubrum).
Trees with high competitive ability often are found in mesic (moist and fertile) soils. Common mesic forest trees are tulip poplar (Lirodendron tulipfera), Northern red oak (Quercus rubra), hickories (Carya spp.), and white ash (Fraxinus americana).
Stress tolerant trees also occur on xeric soil (soils that are very dry). Tree species indiciating xeric conditions include scarlet oak (Quercus coccinea), chestnut oak (Quercus prinus), black oak (Quercus velutina), and Virginia pine (Pinus virginiana).
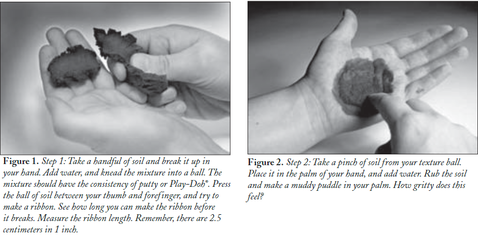
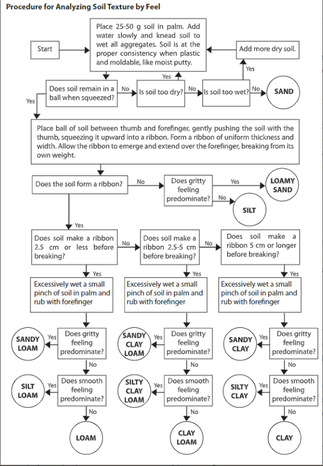
Soil “texture by feel analysis” is a quick approach to measuring soil texture (proportions of sand, silt, and clay in the soil). It consists of adding water to moisten the soil, kneading the soil into a ball in one's palm, and measuring the length of a soil "ribbon" (self-supporting band of soil; see illustration). Depending on whether or not the soil remains in a ball, how long the soil ribbon is, and the smooth- or gritty-feel of the soil classifies its soil texture (Presley & Thein. 2008). With practice, this method can be very accurate.
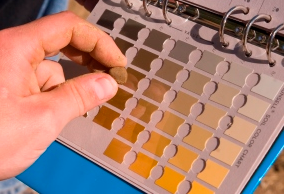
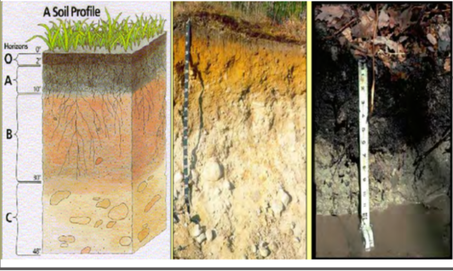
Indicating what color the soil is using the Munsell Color system allows for a direct comparison of soils everywhere. The system takes the hue, value, and chroma to taking into account the order to obtain the most precise color. Soil color can indicate what kind of conditions the plant species are living in. The color is affected by the environment, which could be aerobic or anaerobic environments. (McCauley et al. 2009) Anaerobic environments are lacking oxygen and this type of soil is typically has a high water table. When there is standing water covering the soil, all the oxygen in the water is used too rapidly which causes iron to be reduced, making the soil colorless. If the water stays high for a long period time, the soil will turn gleying or motton. In aerobic conditions, the soil has oxygen present and iron is oxidized, causing the soil to be red.
Soil organic matter is an important component because it contributes to the soil's biological, chemical, and physical properties. Organic matter helps to increase the the solubility of nutrients within the soil solution.
Color is a strong indicator of the organic matter in the soil. When soil contains large quantities of organic matter, it appears as a black or very dark brown color. The dark pigment indicates high fertility and high nutrient level (Lynn & Pearson. 2000).
Measuring soil organic matter can help us to understand forest health and diversity, and can help farmers enhance overall soil quality, therefore lowering input costs.
